


Enterprise Service Management in 2023 and Beyond
In early 2023, ManageEngine created a crowdsourced eBook called “Service management strategies for the next 3 years from 10 ITSM experts and leaders”. It recognised that organisations are likely under pressure to reduce costs, improve products and services, increase employee productivity (and in the context of new ways of working), and deliver better customer experiences through technology-enabled competitive advantage. In creating the eBook, we asked ten IT service management (ITSM) industry authorities to share their insights in response to the following question: “Which three IT strategy areas are critical to the evolution of ITSM in the next three years?”
When the responses from the ten ITSM industry authorities were analysed, there was a wide variety of recommended IT strategic focus areas. However, two strategy areas were called out more than others:
- Addressing people-related issues and needs
- Ways of working or process-related improvements.
One of the points that I discuss in the eBook is enterprise service management, which could help organisations across both of the areas mentioned above. This is “the use of IT service management (ITSM) principles and capabilities in other business areas to improve their operational performance, services, experiences, and outcomes”. This article digs deeper into where enterprise service management currently is and where it’s going over the next few years.
Enterprise service management adoption levels in 2022
In late 2022, HDI released its annual State of Service Management report. It offered North American insights into the opportunities for enterprise service management:
- “45% of respondents report that their organisations are using the principles and practices of ITSM outside of the IT department”
- “82% of respondents report that their organisations have a defined strategy or approach for using ITSM practices/capabilities outside of the IT department”
- “85% of organisations with a service management solution in place say those solutions can be used in non-IT areas of the business”.
While the North American adoption level is lower than the global view of the Axelos 2022 ITSM Benchmarking Report at 51%, with another 19% planning to do so, it still shows the growing use of service management capabilities by other business functions to realise benefits such as:
- Improved experiences
- Increased productivity in terms of operational efficiency and effectiveness
- Reduced costs
- Improved performance insights and decision-making
- Better governance and control
- Increased technology exploitation.
The key drivers for enterprise service management
Nearly a decade ago, as enterprise service management was growing in popularity, common factors – such as consumerisation, demand for service management capabilities from other corporate service providers, improved ITSM solutions, and increased ITSM tool vendor marketing of enterprise service management – were identified as the reasons for increased uptake. Then the global pandemic brought the need for increased digital enablement across organisations.
However, the Axelos Enterprise Service Management Industry Report 2021 shared the enterprise perspective of adoption with the three primary reasons for enterprise service management:
- Process standardisation and optimisation 64%
- Digital transformation enablement 52%
- Employee productivity improvement 51%.
All of these relate to improving the ways of working for employees and the two strategy areas that run through the “Service management strategies for the next 3 years from 10 ITSM experts and leaders” eBook.
Targeted strategy advice for enterprise service management
Two key strategic points are made in the eBook.
Sophie Danby:
“The interest in enterprise service management continues to grow. Still, one of the key industry learnings IT organisations should factor into their sharing of ITSM capabilities with other business functions is that their focus needs to be on improving business operations and outcomes (using select ITSM capabilities), not on the replication of ITSM across the enterprise.”
The bottom line is that enterprise service management is ultimately about better business.
Paula Määttänen:
“Expand ITSM outside of IT. It doesn’t matter that many organisations already use their ITSM tools for Human Resources (HR), Facilities, Finance, etc. – we still rarely call them enterprise service management tools. But many organisations still only use these tools for IT needs and miss out on the benefits of shared technology, processes, and workflows. For both sets of organisations, there are still benefits to be had from expanding ITSM capabilities outside of IT.”
But what does this mean for IT leaders looking to add more business value? There are some common dos and don’ts that will help:
- Don’t use the IT term “enterprise service management” with other business functions, “digital workflow enablement” will likely resonate better
- Get corporate-level, not business-function-level, funding for your enterprise service management initiative
- Don’t sell ITSM capabilities; communicate the available benefits in (line of) business terms
- Optimise IT practices before sharing them and leverage organisational change management (OCM) tools and techniques to help deliver the required people change
- Focus on quick wins to help drive enterprise service management adoption.
The continued growth in enterprise service management in 2023 and beyond
Enterprise service management is a route to “better, faster, cheaper” business operations and outcomes – improving customer satisfaction and increasing productivity while reducing costs.
The continued evolution of ITSM tools will add to this growth, where the use of artificial intelligence (AI) in the form of machine learning and natural language understanding (NLU) technologies is being used to automate routine tasks intelligently. For example, issue resolution and request fulfilment, which not only speeds up execution and reduces costs and errors, it also adds the opportunity for greater personalisation of service and support.
Traditional technology aspects will increase the business value of enterprise service management too. For example, the greater integration of ITSM tools with other enterprise systems, such as customer relationship management (CRM) and human resources (HR) systems, allows for end-to-end service delivery processes in both IT and the business functions benefitting from the digital enablement capabilities of ITSM tools. This integration also brings end-to-end insight that enables more-informed and better decision-making.
The eBook “Service management strategies for the next 3 years from 10 ITSM experts and leaders” is a compilation of strategy-driven solutions your organisation can apply to tackle digital transformation and service management challenges, delivering insights from 10 ITSM industry authorities. You can download a free copy of the eBook here. You can also follow the ManageEngine YouTube channel for video insights from the contributors, including myself here.
By Sophie Danby, ITSM.tools



Immerse yourself in the world of ITSM at SITS – The Service Desk & IT Support Show, this Spring
Registration for SITS – The Service Desk & IT Support Show is now open, as the exhibition announces its return to ExCeL London on the 10-11 May 2023. Last year’s SITS was the first since the pandemic, and the industry were keen to reconnect in person, and catch up on what had been going on in the world of IT Service Management.
‘See solutions in action and speak to the experts’
Over the 10-11 May 2023, 60+ ITSM vendors and cutting-edge start-ups will be demoing the newest IT service solutions and answering questions, with the goal of streamlining ITSM systems. Visitors will have the opportunity to meet with teams and easily compare service offerings from leading brands like Freshworks, Hornbill and AnyDesk.
Event Director, Alice Fulton said “The innovation and development we are seeing in the IT Service Management sector currently is electrifying. We have fabulous individuals and teams working hard and showing tenacity like no other.” She continued “SITS 2023 is really looking like a world class showcase of our amazing industry.”
‘Learn and discover the latest thinking in ITSM’
SITS is also excited to deliver the only free ITSM education programme in Europe. Over two days, three theatres will hold 60 free educational sessions, alongside a Keynote theatre, Breakfast Briefings and Hot Topic workshops. This year's presentations include everything from AI and digital transformation to Experience Management and ITIL, with new and crucial sessions on topics including diversity and mental health.
“Attending SITS was so valuable, I implemented changes I had learnt in the seminar sessions as soon as I got back to the office. You will gain focus and excitement about your job,” said the Service Desk Manager for Amplience, following a visit to SITS 2022.

‘An excellent opportunity to network with like-minded professionals’
This year’s exhibition will be bringing together thousands of industry peers, to discover the latest innovations, share the latest thinking and have conversations that can move ITSM careers forward. There will also be plenty of new features to explore, including surprise entertainment, post-show drinks and a photobooth.
SITS, The Service Desk & IT Support Show, is back 10-11 May 2023 at ExCeL London. You can now register for your free ticket here.

Could Financial Wellbeing Combat the Cost of Living Crisis?
Chris Budd wrote The Financial Wellbeing Book back in 2015, since when he has also been producing the Financial Wellbeing Podcast. He is founder and remains Chair of financial planning company Ovation Finance Ltd. For many, life is tough, and getting tougher. The well documented cost of living crisis has caused many people to face some very difficult decisions about how they spend their money.
If you don’t already, you might spend some time trying to understand where your money goes. I know it’s a job we all hate, but bear with me, because this might lead you to some interesting conclusions.
Take a look at where you have been spending over the last, say, six months. Break down your spending into these categories: essential (including food and interest on debt); nice to have; luxury; the future (savings and pensions plus repayment of debt).
Once you have this breakdown completed and in front of you, you will want to come back to this article.
There are some principles about financial wellbeing – the relationship between money and happiness – that you might like to apply to the results of that review.
Financial Wellbeing Junkies
This is an expression which relates to buying stuff to alleviate your mood. You are feeling a bit low, so let’s go online or pop into town and get ourselves some retail therapy.
We arrive in adulthood with a set point of wellbeing (interestingly, at least half of this set point we are born with!). We then oscillate around that set point as we go through life. A good thing happens, and we are at, or maybe even above, our set point. In time (and usually a fairly short amounts of time), we settle back to that set point.
Sometimes, however, stuff gets us down, and the reaction can be to buy something that will make us feel better.
Retail therapy.
The trouble is, such purchases only bring very shortly bursts of financial wellbeing. When that hit of wellbeing dies away we are left with more debt, that can make us more unhappy – which leads to us to spend more money get more hits of wellbeing.
Constantly chasing hits of wellbeing through retail therapy can turn us into financial wellbeing junkies.
Wellbeing From Experiences
Far better to seek wellbeing from experiences. These produce memories, which is a much longer lasting source of wellbeing.
Experiences are a better way of spending your money, but even better would be to get memories without spending money at all. Exercise, maybe a nice walk or a run, is free, and is proven to release endorphins and other chemicals which make you happy.
Social Wellbeing
A long lasting study by Harvard University asked young people what they thought would bring them happiness during their lives. The response was consistent: money and fame.
The study returned to these people as they went through their lives to check what was actually bringing them wellbeing. They’ve been talking to them for around eighty years!
The overwhelming response to what brought wellbeing throughout their lives was not money, nor fame: it was the quality of their social relationships. Check out the Harvard Study On Happiness on YouTube (22m people already have!).
The Source Of Joy
If we seek our wellbeing from buying stuff, or from approval of others (fame), or similar external sources, then we are forever chasing happiness.
If only there was a source of happiness that was endless; that didn’t rely on other people, and didn’t require money! If only we could break the link between our self-worth and our net worth.
If you gain self-worth from internal sources, then you are in control. If you are feeling low, you can simply turn on the self worth tap, feel better.
What is this magic source of joy, of internal self worth?
Compassion.
The joy of giving, of helping others, is a major source of self worth and therefore of wellbeing.
Start Again
Happiness, wellbeing, joy; all these come from spending time with others, creating experiences and memories; helping others; and free stuff such as sunshine on the skin, healthy eating and exercise.
Now go and undertake that review of your spending. Are you spending your money on stuff that brings you wellbeing? It might be possible for you to change your spending habits and achieve a greater wellbeing even within a new, limited budget.
By Nick Elston

Expert insight: Delivering a fluid customer Journey
Technology-backed service improvements in the legal sector typically deliver a customer experience that feels seamless, faster and familiar. “Familiar” because it reflects day-to-day life where clients engage with Amazon, Uber, online banking services and so. Today’s clients are comfortable online.
With services and pricing so competitive, many organisations seek competitive advantage by kick-starting technical projects related to customer experience. Doing so without any real understanding of the customer journey is unlikely to deliver the desired improvements. The starting point has to be mapping the customer journey.
As you map the journey, note the customer’s expectations, their pain points and those “make or break” touchpoints that define how they feel about your organisation. In this way, you can see what areas need improvement and at which stages technology might deliver benefits. Negative impacts occur when organisations employ technology for technologies sake – feeling pressurised to “digital transform” without pausing to reflect on what’s truly needed.
Customer journey mapping highlights where service responsiveness, accuracy, knowledge, availability, reliability and so on is lacking. Increasing organisations are choosing Robotic Process Automation (RPA) to revolutionise process efficiencies and deliver the very improvements needed. Put simply, RPA is just software (known as bots) that automates a process. For example, onboarding a client, invoicing, searching through files, providing answers to frequently asked questions and so on. By its very nature it provides those levels of response, accuracy, reliability etc. associated with a superior service experience.
We’re talking about immediate responses to client emails. 100% accurate billing. Bots are designed to handle and manage data, to open and “read” emails, to scan and process document. – so much of that forms the bedrock of a legal firm’s service. Client s don’t need a human to send emails that acknowledge contract or download, search and provide data.
Without question, there are points in the journey where a human touch is what is required. Using RPA for the logical tasks liberates your employees to focus on clients that need a human connection. Even in the legal industry, the future holds this combination of human workers and bots delivering the customer experience. Your employees will drive improvements using their emotional intelligence. RPA is a huge opportunity to complement your employee’s abilities to overcome customer hurdles and deliver an experience fit for today’s competitive landscape and the future.
By Eileen O’Mahony, General Manager, WM Promus
*For more information, please contact us for a free consultation.
(Tel: +44 (0) 203 946 6226 | Email: [email protected])

80% of the Employee Lost Productivity Caused by IT Support Comes from Just 12.6% of Tickets
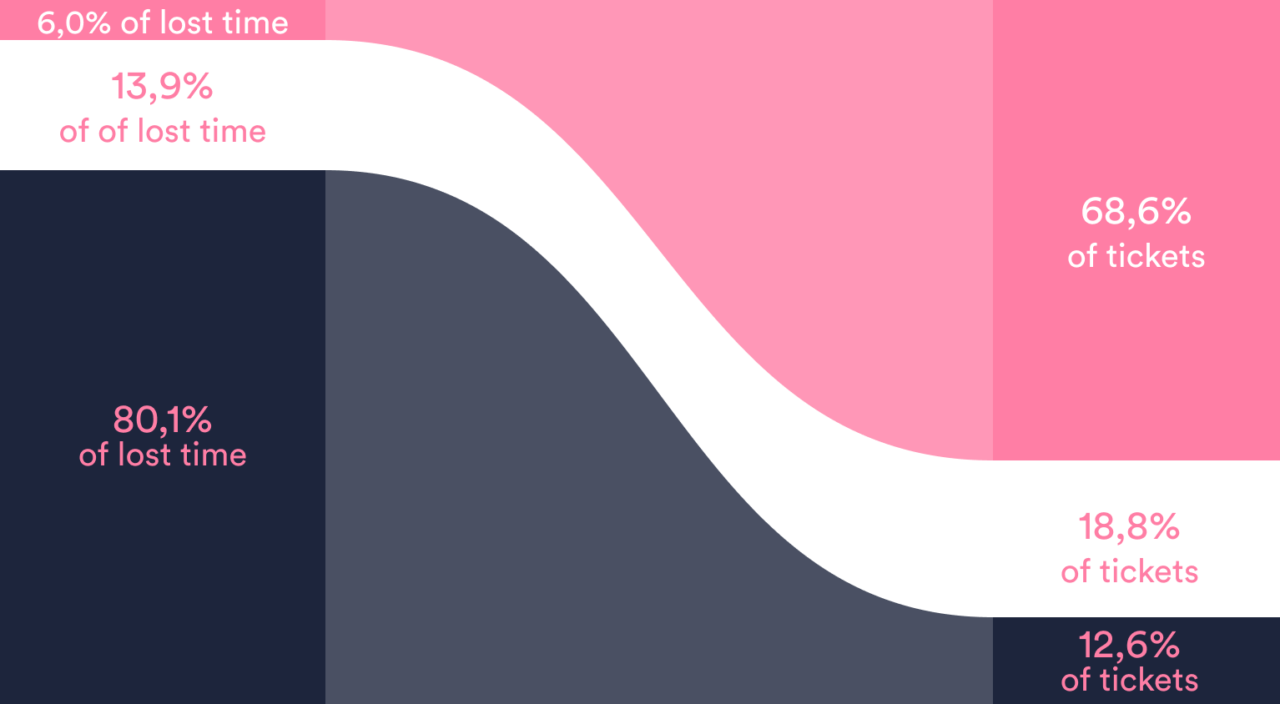
Our experience management platform’s insights have long helped our customers improve their IT operations and business outcomes. The shared aggregated data has also provided the IT industry with valuable end-user statistics such as happiness levels and the average employee lost time with incidents. However, the latest insights from The Global IT Experience Benchmark: H1/2022 offer a new perspective to anyone responsible for corporate IT support – that 80% of employee perceived lost productivity is caused by just 12,6% of tickets (as shown in the graphic below).
Source: HappySignals, The Global IT Experience Benchmark: H1/2022
The graphic also shows that 68,6% of tickets account for just 6% of employee perceived lost productivity.
Please keep reading for more details on this lost-productivity disparity and what this means.
The power of experience measurement
If your IT organization is like the many others we help, it will have a wide range of IT service management (ITSM) metrics. Many of which are focused on the IT service desk. They’re probably best practice metric areas and, hopefully, your IT service desk is consistently achieving its performance targets. This provides a “sea of green” on the IT service desk performance dashboard (or in reports), but for some reason, employees or end-users still aren’t happy with the service and support they receive from IT.
This performance gap is the service level agreement (SLA) “watermelon effect” that’s increasingly discussed (as the cause of IT issues) where, while green on the outside, there’s red hidden on the inside. Importantly, this red is seen by end-users, but the IT service provider is blind to it thanks to the employed metrics and the limited insight they offer.
Consequently, organizations are increasingly looking to employee experience measures to understand IT performance better, moving from what has traditionally been a supply-side, point-of-creation view to understanding the demand-side, point-of-consumption perspective. The experience data showing that 80% of employees perceived lost productivity is caused by just 13% of tickets is a great example of this.
Looking beyond averages to see more valuable trends
One of the key statistics we’ve shared with the IT industry for the last half-decade is the employee perceived lost productivity average. This average is across all of our customers (long-term and new) and includes all end-user feedback on IT incident handling. For H1/2022, this figure was three hours and 9 minutes, i.e. across all of the pieces of end-user feedback, employees perceived that they lost an average of three hours and 9 minutes.
This average has many uses. For example, customers can see where they are relative to peers, and the perceived lost productivity is dropping as they improve their IT support capabilities (and the experiences they deliver) over time. Non-customers can also benefit from understanding that employees feel they lose so much productivity, while traditional IT service desk metrics show that incident tickets are being closed in line with agreed SLA targets. It’s a valuable insight that helps everyone.
This new analysis now delivers an insight that has likely been unknown to IT service desks for the last three decades – that the spread of lost productivity levels is imbalanced, and very few end-users are “at the average.”
This imbalance is shown in the graphic below. It details the spread of employee perceived lost productivity between 2019 and 2022 based on close to eight million pieces of end-user feedback.
Source: HappySignals, The Global IT Experience Benchmark: H1/2022
There’s a high level of incidents with only 15, 30, or 45 minutes of perceived lost productivity, with 69% of interactions losing the end-user less than an hour’s productivity. But if the end-user doesn’t sit in the 69%, with an hour or less perceived lost productivity, they will likely lose more than a day.
It’s again important to reiterate that the average doesn’t reflect the typical level of lost productivity. This data is unlike a normal or Gaussian distribution, where there’s a hump in the middle, and there are not many tickets that actually had three hours of perceived lost productivity. It’s also essential to understand that end-users report their perceived lost time using a non-linear scale. This scale starts with the greater granularity of choice, as is shown on the graphic’s x-axis (the feedback scale can be seen in this demo feedback form).
The big question(s) for IT support organizations (and the IT industry as a whole)
What are the 13% of tickets that are causing the 80%? And are we – either individually or collectively – focused on the 13% enough?
The main issues here are:
- The 13% and its impact are hidden for most, if not all, organizations
- Without this insight, the 13% can’t be understood and addressed.
We need to analyze the data more to better understand the cause of the 13% across our customers, but we do have some thoughts about possible root causes.
The first is that when SLA targets are breached, perhaps due to the involved complexity, the focus moves to the tickets still within the target. This cause might be a service-provider policy or related to service desk agent motivation, with them dropping the now-breached ticket to focus on the tickets that will allow them to meet their personal and team targets. So, it’s simply a case of the SLA targets driving a certain type of agent behavior.
A second potential cause is that there are more reassignments between resolution groups, especially for more complicated tickets. This cause can include tickets being routed to third-party support providers, which further adds to the resolution delay (with the SLA clock potentially paused when the resolution is not under the IT service desk’s control). Our customers and we have long known the adverse impact of ticket reassignment on end-user happiness and productivity. In the latest Global IT Experience Benchmark Report, each reassignment causes happiness to drop by close to 8 points, and end-users think they lose one hour and 35 minutes of productivity.
A third idea is something that is often associated with “aged tickets” – communication “breakdowns.” This cause is, for example, when the IT service desk requires more information from an end-user. They leave a voice message or send the end-user an email and “stop the clock.” Sadly the end-user doesn’t see or act upon the request promptly, and maybe multiple times, and perceives the time taken to be excessive. The IT service desk, on the other hand (and thanks to the “clock stopping,” is still seen as handing the incident within the agreed SLA target. Hence, there’s no issue from the service-provider perspective. This cause might be even less visible when “three strikes and close” policies are applied to non-responsive end-users’ tickets. While “aged ticket” volumes are reduced, the employee experience is, too (and a new ticket is commonly opened to progress the issue when the end-user follows up).
No matter the root cause(s)…
While more needs to be done to understand why the 13% exists, your organization must have the ability to identify its 13%. It might have sight of “aged tickets” and address these periodically (meaning months of lost time, not days). But how much insight is lost through “clock stopping” and automated ticket closure? The bottom line – is this situation a significant cause of end-user dissatisfaction with IT that’s hidden by IT policies and practices?
Think about it. All of the improvements that your IT organization and IT service desk have implemented to date and have planned for 2023, are they focused on the simpler issues where end-users are already happy with the level of their lost productivity?
So, if you really want to create additional value for your business, find out what the 13% of delayed tickets are and then focus on them. This action could be improvement initiatives or simply prioritizing these tickets in terms of IT service desk focus.
Sadly, as service consumers, we remember the poor experiences far more and for longer than the good ones. And by proactively identifying and addressing the 13% of tickets (that lose end-users so much productivity), whatever the cause, your IT organization can take positive steps in closing the gap between service-provider and service-receiver perceptions. It might be that the quicker ticket resolutions lengthen slightly as a result of this focus. Still, the overall impact on business performance and IT’s reputation will likely be better for all.
For me, personally, this is probably the most important finding in the history of HappySignals experience data collection and analysis. This new insight should challenge the whole IT industry’s perspective of IT support and whether we’re focused on improving the right things.
Get your free copy of the latest The Global IT Experience Benchmark Report.
By Sami Kallio

Strategizing IT incident management in a hybrid work environment
Navigating the post-pandemic era with hybrid work model
A recent survey by NASSCOM suggests that 70% of the organizations are looking at the hybrid work model as a long-term option as it offers flexibility, convenience, and enhances productivity. Although the hybrid work model enables organizations to be versatile, it also presents unique challenges for handling IT and managing incidents. Some of the key challenges include:
1. A complicated IT landscape:
Employees often use personal devices in their role, and organizations frequently enable access to critical files through VPN from unsecured networks, which increases the probability of IT incidents.
2. Lack of a hybrid-ready self-service:
Without adequate information, such as knowledge articles on frequently used services, VPN, and security best practices, end users might not resolve common incidents themselves, raising a flood of L1 (Level1) tickets which are routine in nature.
3. Absence of an omni-channel service desk:
Incidents reported by end users might slip under the radar if the service desk is unfamiliar with select platforms or applications.
4. A burned out IT workforce:
Service desks, lacking efficient workload distribution, might end up overburdening their IT technicians, leading to burnout.
5. Working in silos inhibits collaborative approach:
As dispersed IT teams work in silos, they can lose track of incident tickets assigned to each other, resulting in a duplication of efforts.
Strategize your incident response for a hybrid future
As your IT service desk aligns itself with the future of work, you can strategize your IT incident response tailor-fit to your organization by leveraging remote monitoring tools, curated self-service portals, delivering an omni-channel experience, employing resource planning, and encouraging collaborative approach.
1. Monitoring the IT landscape remotely:
As organizations handle a complex IT landscape under a hybrid work model, they can adopt a proactive incident management strategy by integrating their ITSM software with remote monitoring tools.
For example, when threat actors gain access to end-user workstations, monitoring tools trigger alerts. These alerts can be automatically converted to incident tickets, assigned a high priority, and routed to specialist support groups. By configuring condition-based automations, IT teams can tackle major incidents head-on, ensuring their hybrid workforce faces no service downtimes.
2. Furnishing adequate information using curated self-service portals:
Organizations can tackle the information crunch that end users experience by curating a self-service portal that helps reduce IT service desk tickets for both the on-site and remote workforce. Incident templates and quick-action widgets can help end users report data security incidents faster with accurate information collection. This helps IT service desks accelerate incident resolution and mitigate the risks of data breaches and ransomware attacks.
Knowledge articles addressing common incidents, like VPN and account lockouts, can empower users to resolve incidents by themselves. IT service desks can leverage AI to intelligently suggest relevant knowledge base articles for end users when they submit a ticket. This can also help ensure the ticket is channeled, if needed, to the appropriate IT service technician, and can help avoid the need to escalate it. This way, IT teams can focus on high-priority incidents and ensure service uptime.
3. Delivering an omni-channel experience:
IT teams can integrate remote collaboration platforms like Microsoft Teams and Slack with their service desk solutions to capture incidents reported on these channels. Users can raise tickets, access the self-service portal, browse the knowledge base, and more without switching windows.
IT service desks can also enable end users to chat with technicians in real time, ensuring rapid ticket resolution or escalations if required.
Building an omni-channel service desk solution helps IT teams stay on top of all incidents reported across disparate channels.
4. Embracing resource planning for elevated service desk productivity:
Organizations can prevent IT service desk technician burnout by employing efficient resource planning strategies.
Optimal scheduling algorithms and AI can direct incident tickets to specialist support technicians based on their availability and expertise. Analytical tools, like Zoho Analytics, can help IT admins discern attendance and absence patterns for these support technicians.
Organizations can then set up automations to delegate tasks and tickets to backup technicians, ensuring the around-the-clock availability of IT and organizational support.
5. Breaking the silos by encouraging collaborative approach:
Organizations can embrace a collaborative approach to break the silos and streamline their incident resolution process while overcoming the challenges posed by a hybrid IT support workforce.
Ticket collision warnings can help prevent duplication of efforts when multiple technicians work on the same ticket.
Technicians can also collaborate to resolve major incidents by adding internal notes, sharing the incident ticket, delegating tasks to different specialists or groups, or using integrations with collaboration platforms like Microsoft Teams and Slack.
Service desks can also broadcast critical information on such incidents, providing a heads-up to IT technicians handling the incoming wave of tickets. Similarly, the service desk can reassure end users by making periodic announcements during major incidents.
Stay ahead of the curve with a responsive service desk:
As organizations adapt to a hybrid future, IT teams might face several challenges while managing incidents that threaten their technological infrastructure. A flexible ITSM solution like ManageEngine ServiceDesk Plus can go a long way in helping an organization stay agile and resilient.
As ManageEngine's flagship ITSM platform, ServiceDesk Plus helps organizations achieve a 3-year ROI of up to 352% on their ITSM investments.
This article was originally published on servicedeskplus.com, on June 28, 2022, written by Nisha Ravi.

Is It Time to Understand More About MSPs and How They Help?
Much of what is written and read in the IT service management (ITSM) space relates to enterprises, their ITSM capabilities (including ITSM tools), and how they need to consider these capabilities in light of several ITSM trends. Whether it’s better end-user experiences, enabling digital transformation initiatives, the opportunities for artificial intelligence (AI) and increased automation, changing skill sets and recruitment issues, enterprise service management adoption, or something else, what’s written often assumes that the reader works for an organisation that delivers its IT services in-house (bar the use of public cloud, of course).
They and you might do, but what about all the IT and ITSM professionals who work with or for a managed service provider (MSP)? All of what’s written is relevant to them too. In fact, it could be argued that much of what’s written is even more relevant to them – with MSPs often winning deals based not only on cost but also on quality and innovation factors.
But what do you know about MSPs? Especially in terms of whether they could help your organisation. This article has been written to help.
The evolution of MSPs
MSP “history” likely doesn’t interest you, but it’s worth understanding where the outsourcing of IT management and ITSM capabilities started. While the origin story of MSPs usually calls out the emergence of application service providers (ASPs) in the 1990s, the outsourcing arrangements of the early 1980s saw organisations outsourcing business processes that, while necessary for business operations, were not considered core competencies. This opportunity to outsource included IT capabilities.
Fast forward to the present day, and MSPs now offer a variety of IT management capabilities that include aspects of ITSM. These service-based capabilities apply to organisations of all sizes – from small-to-medium enterprises (SMEs), through mid-market organisations, to the largest enterprises. And while different MSPs likely offer differing service portfolios, they’ll usually offer services related to:
- Network and communications management
- Infrastructure management, including hardware health
- Asset management, including software subscription and mobility management
- Cybersecurity, including firewall administration
- Data storage management
- Backup and recovery.
These services are delivered through a mix of skilled personnel, industry best practice processes, and fit-for-purpose technologies that include automation and, increasingly, newer artificial intelligence (AI)-enabled capabilities.
Two common elements of an MSP’s toolset are remote monitoring and management (RMM) applications and professional services automation (PSA) tools:
- The RMM applications allow MSPs to maintain networks, end-user systems, servers, and mobile devices. These tools can also apply patches, run scripts, and install system updates.
- The PSA solutions enable MSPs to supervise customer projects, handle accounts, and take charge of assets and inventories.
The increasing demand for MSP services
As with any market sizing figures, there are different opinions on what the MSP market currently looks like and where it is heading. These estimates, like any future predictions, will depend on what’s included scope-wise and the bullishness of any assumptions.
Based on a study by Grand View Research, Inc., one recent sizing example is that the global managed services market is expected to reach USD 731.08 billion by 2030. This growth is a projected CAGR of 13.4% from 2022 to 2030.
It’s a significant number – in both sizing and growth terms – but, more importantly, it’s driven by some considerable customer opportunities and issues where MSP use will help.
The why of MSPs – how they help
Don’t worry; we’re not trying to sell you anything (unless you work for an MSP)!
While many might look at the outsourcing model as a way to save costs or, as already mentioned, perhaps to get access to best-practice operations and innovations more quickly, the opportunity or “why” of MSP use is broader. Especially as technology advances more rapidly and end-user expectations of IT service delivery and support increase in line with employees’ consumer-world experiences.
Here are some common MSP benefits (to add to the oft-quoted cost reductions):
- Access to new ITSM capabilities. Whether this is missing ITSM practices such as problem management, new techniques such as swarming, or new technologies such as AI that drive quicker operations, lower costs, or better end-user and business outcomes.
- Immediate access to new expertise. Whether this relates to technologies, IT service delivery and support capabilities, regulatory or legislative requirements, or something else. The right MSP will acquire and provide this expertise so your organisation doesn’t have to.
- Provision of hard-to-source expertise and capabilities. One of the highest-profile examples of this right now is security and compliance. While you can’t outsource the responsibility, MSPs can provide the required expertise and capabilities and the assurance these bring.
- Easier access to scarce IT skills. Some IT skills are hard to come by, and perhaps budget busting. Let an MSP recruit, develop, and retain the resources your organisation and others need.
- The scalability of service and support operations. An MSP can more effectively manage demand peaks and troughs than any single organisation can.
- Greater access to improvement. For example, when an improvement made for one client is shared with all clients.
- Offer your organisation 24x7 support. MSPs can provide this thanks to their multi-client model, while your organisation might not be able to alone.
Ultimately, MSP use allows your organisation to focus on its core business and key strategies, whether this is keeping customers happy or growing market share and revenues. The same applies to your IT organisation, with IT or ITSM professionals able to invest their time in higher value-add activities rather than being bogged down in the high-volume, low-value IT tasks that currently prevent them from improving business productivity and outcomes, especially when the employed MSP is leveraging AI-enhanced automation to enhance the speed of operations, insights, and decision-making, and the delivered end-user experiences.
If you’d like to learn more about how an MSP could help your organisation or new technologies are propelling MSP capabilities forward, you can do so here.
By Praveen Ramesh, SuperOps.Ai


The top 5 benefits of ITIL aligned software
Adopting an ITIL aligned software solution can play a core role in your overall business strategy. ITIL is a framework designed to standardise the selection, planning, delivery and maintenance of IT services within a business. The consequence of this standardisation of process allows businesses to optimise and improve their service delivery and gain greater transparency over their efficiencies and costs. We have outlined below the 5 main business arguments for adopting an ITIL aligned software solution.
1. Creating an alliance between IT and business goals
By adopting ITIL and using an ITIL aligned software solution, you create the opportunity to help fuse your IT operations with your business goals. The popular axiom is that ITIL does not create business strategies, rather, it enables and supports them by ensuring that IT and business work according to aligned goals. As a business executive, securing an ITIL aligned software and ensuring ITIL’s standards are fully integrated into your IT services is paramount to delivering greater accountability into your organisation and increasing visibility of the utilisation of your resources.
2. Improved change management processes
An industry standard change management procedure is key in providing greater accountability for your organisation and avoiding service disruptions to critical services. Change management aims to ensure that standardised methods and procedures are used for efficient handling of all changes. A change is an event that results in a new status of configuration items, is cost-effective, enhances business process, with minimum risk to infrastructure.
3.Greater transparency of IT costs
As indicated earlier, embracing ITIL will help your executive team gain greater transparency over your IT costs. By adopting ITIL procedures, you can provide greater clarity of the utilisation of your IT resources and ensure your team and assets are allocated correctly. Operational processes, such as incident and problem management, are more efficient, controlled and measured, which can increase productivity and the satisfaction of both staff and customers.
4.Optimised service delivery
By using proven ITIL processes, you will see a marked improvement in your service delivery metrics. By using an ITIL aligned software solution, you can quickly create optimised incident management and problem management processes and workflows. These then allow your organisation to quickly restore services and use trusted, well developed workarounds. This in turn ensures a faster and improved customer/end-user experience.
5. Improved reliability of service
Again, by adopting rigorous Incident and Problem management processes, you are able to anticipate and avoid disruptions to service. ITIL processes can introduce more accountability to major incident reviews, help eliminate root technical causes, and prevent such incidents from reoccurring. These together improve your overall service reliability metrics.
ITIL Qualifications
For more information regarding ITIL in the UK, see Axelos, a joint venture set up in 2014 by the Government of the United Kingdom and Capita, to develop, manage and operate qualifications in best practice.
HaloITSM as an ITIL-aligned solution
By maintaining the standards enabled by our ITIL-aligned solution, our customers have used HaloITSM to help optimise their service delivery. Below is a list of some of the features that are included within the HaloITSM product that are aligned with ITIL best practices:

5 Ways to Improve your Wellbeing in Your Lunch Hour - Make Your Lunch Break Count
When was the last time you took a lunch break? As in an actual break, away from your desk?
Most of us have breaks included in our contracts and terms of conditions, yet research shows that around 70% of us eat lunch at our desks.
This is such a well-known issue that it has been described as 'FOLO - Fear of Lunching Out.'
April 13th each year is 'National Make Lunch Count' Day in the U.S.A. This was created by the chain T.G.I. Fridays to help encourage workers away from their desks and to take a break.
This isn't an issue that just exists in the U.S. In the U.K. it is estimated that:
-
A third of employees do not leave their workplace during the day,
-
Over half do not take the full amount of time that they are entitled to,
-
Nearly 70% say they are too busy to stop.
An increase in working from home does not appear to be helping this either.
Interestingly, from all the articles and research I have looked at*, it appears that this is more often by choice of the individual rather than the company or a manager requesting that people work through.
This raises the question of how much of this is the company culture, and the behaviour of others that influence this, as opposed to a conscious choice.
In the findings of the Deloitte Wellbeing at Work research* the top 3 key issues with work-related stress were:
-
The pressure of competing priorities and performance targets.
-
Workload resulting in longer hours and inability to switch off.- Including reluctance to take leave and time off. (leavism)
-
Lack of support.
In the 2017 report, 84% of people experienced poor mental health, with work being a significant contributing factor.
In the 2020 report, the research showed a significant increase in 'leavism'
'Presenteeism' - (Being at work but being less productive), alongside 'absenteeism' is a rising issue nationally costing 45 billion per annum.
Taking a proper meal break not only has a positive impact on the individual, it also has a knock-on impact on the workplace culture, 'presenteeism', 'absenteeism' and even 'leavism'
It is a small step that can be taken, which can have a significant impact on our productivity, energy and overall wellbeing.

The NHS defines 5 steps that you can take to improve your wellbeing.
Here are some simple ideas to improve your wellbeing during your lunch hour, based on the 5 pillars.
You might even be able to combine some of them.
1. Connect with other people
-
Phone a friend or family member and catch up
-
Go for a walk with a colleague
-
Sit and eat with someone else, avoid work chat
-
Arrange a catch-up date with someone and put it in the diary
2. Be physically active
-
Go for a walk
-
Have a stretch, or do some yoga or pilates
-
Get up and move around the office or building
-
Visit the gym or preferred exercise/activity
3. Learn new skills
-
Read a blog or article that helps you learn something new
-
Commit time to read a book that helps you develop your self or skills/knowledge
-
Listen to an audiobook or podcast
-
Take advantage of working from home by cooking/making something new
4. Give to others
-
Check-in with someone who is having a tough time
-
Call/message someone to show your appreciation
-
Complete a random act of kindness
-
Think of a colleague you could email to thank them for their contribution, cc their mgr (when back at the desk!)
5. Pay attention to the present moment (mindfulness)
-
Sit and enjoy your food without distraction
-
Take a walk and pay attention to your surroundings
-
Complete a mindfulness/mediation/relaxation exercise
-
Reflect on the day so far and recall 1-3 things that have gone well
These are just some suggestions. The main aim is to hit ctrl, alt, delete, and walk away from the computer and your desk.
-
Change your location
-
Change your physical state
-
Change your mental and emotional state
The benefits significantly outweigh the time you have stopped working.
Start with just eating away from the desk and then build up to maximising the use of your time to increase your wellbeing.
If you would like more help, support or guidance on changing this, or other habits and behaviours then check out the free resources or book in a clarity call and we can talk through how coaching can support you.
By Zoe Thompson, Phoenix Life and Wellbeing Coaching
Three Key Employee Experience Insights from 2022
Most IT organisations are under pressure to meet business needs better and increasingly need to deliver more while reducing costs. To help, HappySignals recently released The Global IT Experience Benchmark: H1/2022 Report, which includes a wealth of insights into the employee experience of various aspects of global IT service management (ITSM). It’s based on the operations of, and improvements made by, HappySignals customers. So, while the data and insights are helpful, an organisation that’s new to experience management needs to remember that these averages reflect a mix of experience management journey states – from the organisations just starting to those “a few years down the road”.
So, hopefully, you’ll click through to read the full report to see where other organisations are identifying issues and addressing improvement opportunities. If you’re unsure about what the report covers, here are three key employee experience insights from this latest data set.
How The Global IT Experience Benchmark Report is created
The Global IT Experience Benchmark: H1/2022 Report data is collected from HappySignals customers, including large enterprises and managed service providers (MSP) who use the HappySignals Platform with their customers. All the feedback responses are from IT end-users (employees) and reflect their feelings and perceptions about IT.
This latest report shows the findings and analysis based on 840k end-user experiences with IT.
Employee experience insight #1: Incident-related employee lost time is unevenly distributed
If you’ve read a management book, you might have encountered the Pareto Principle. This principle states that for many outcomes, roughly 80% of consequences come from 20% of causes (the “vital few”).
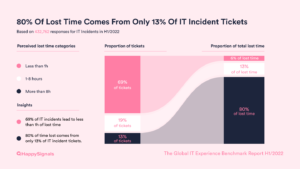
The Global IT Experience Benchmark: H1/2022 Report identified something similar for incident management – that 80% of the perceived employee lost time (caused by incidents) comes from only 13% of tickets (based on 433k pieces of feedback). The chart below shows not only this but also that 69% of tickets account for just 6% of perceived lost time.
This situation has changed slightly over time, as shown in the chart below.
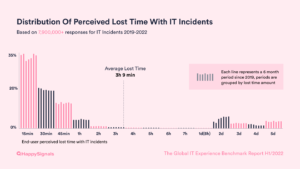
The Global IT Experience Benchmark: H1/2022 Report chart offers other interesting insights. For example, the high level of incidents with only 15, 30, or 45 minutes of lost time. So it’s also important to appreciate that the perceived lost time average doesn’t reflect the typical lost time. Or the growth in incidents that are perceived to incur two days of lost time and the polarisation of perceived lost time across the scale.
However, in interpreting this data, it’s important to understand that the way end-users report their lost time is on a non-linear scale that starts with greater granularity of choice. This scale can be experienced in this demo feedback form.
An interesting consideration of this polarisation is whether the experience data goes against the traditional incident priority and resolution-time matrices such as:
- P1 = 4 hours
- P2 = 8 hours (one day)
- P3 = 24 hours (three days)
- P4 = 40 hours (five days)
Resolution times might either well exceed these service-level targets (in the main) or fail to hit them, but perhaps few are close to the right side of the targets. However, the HappySignals insight relates to perceived lost time data rather than the logged resolution-time data. Nonetheless, it’s still worth checking via your ITSM tool and with end-users as to whether the agreed priority-based service levels are still relevant.
However, the big question is “Why?”, i.e. why the lost time feedback is distributed like this. Currently, we don’t know the answer and need to undertake more analysis. It could be that once a service-level target is breached, there’s no incentive for a service desk analyst to resolve that incident quickly. I’m told this is a little like the British late-running-train theory where an already-delayed train is delayed even further because on-time trains are given priority and allowed to pass it to ensure they aren’t late too. But right now, this is just a hypothesis that we need to investigate further.
Plus, this insight doesn’t differentiate the feedback based on incident priority. For example, understanding the percentage of P4 incidents resolved within an hour or P1 incidents that take longer than two days to resolve would add valuable insight (including to the causes of the above lost-time distribution).
So, what do you think are the likely causes of these extreme perceived delays in resolution? Please let me know.
Plus, is this view representative of your organisation’s incident backlog? Perhaps with delayed incidents waiting on problem management activity for a resolution or workaround.
Finally, do you currently have the capabilities to understand how your end-users lose time to incidents and in the IT support they receive? I’d be willing to bet that things differ from what your traditional IT service desk metrics tell you.
Employee experience insight #2: Employee remote-working experiences are improving
If, like many organisations, your Human Resources (HR) department elected to continue the opportunity for employees to work remotely post-pandemic, do you know how this impacts employees? Whether from an employee productivity or wellbeing perspective, or how IT service delivery and support capabilities are either helping or hindering employees as they work from anywhere.
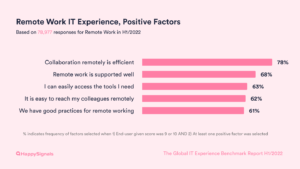
At the outset of the pandemic, the HappySignals Platform added the ability for customers to gain insight into employees’ issues and experiences when working remotely. The H1/2022 feedback dataset offers valuable insights into the IT contribution to employee remote working – with this a high-scoring IT area (as shown below). Our customers have also increased employee happiness with remote working from +60 to +75 over the past year.
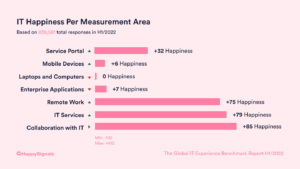
But the granular report data offers the most helpful insights – showing what’s working well, and not so well, for remote-working employees. It’s also indicative of what might be most important to them. The chart below shows the positive factors that influence good experiences.
While the next chart shows the negative factors that cause poor experiences.
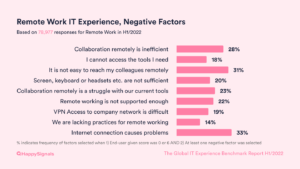
It’s interesting to see collaboration capabilities high in both lists. But it’s important to appreciate that there’s no one-size-fits-all approach to how IT teams can optimise remote working for their organisation’s employees.
The only way to find out is by collecting data directly from your own end-users. For example, employees may have different needs in different locations or work in areas where the internet access and cultural differences make remote work more or less challenging.
So, now that remote work is normalised in many regions, IT teams can use experience data to find pockets of improvement to optimise remote work for all employees and specific groupings with issues.
Employee experience insight #3: Geography is important with employee experience
The dangers of looking at averages in isolation highlighted earlier (with the perceived lost time data) can also be extended to demographic-based factors. For example, an organisation’s size and industry vertical. However, one of the most interesting insights relates to geography.
Previously, The Global IT Experience Benchmark Report showed analysis by country, but for the H1/2022 edition, we took a region-based view to highlight the differences (and feel free to contact me to access the country-based data and deltas).
As shown in the chart below, some regional differences are significant. For example, Western Europe has by far the lowest Happiness score. But, they also have the lowest level of perceived lost time (caused by IT incidents). Or when North America and Africa are compared, the Happiness scores are close – +77 and +78, respectively – but end-users in Africa perceive that they lose close to 2.5 hours more time than their North American peers (and are still slightly happier than their North American peers).
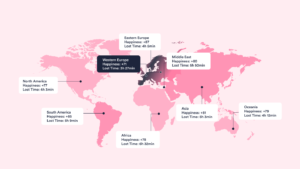
This chart (and the data that feeds it) highlights the impact of geography and culture on employee experience, which organisations need to bear in mind when aiming to improve their scores. For example, Western European organisations would struggle to get close to the Eastern European Happiness high of +87 from their current +71 score. Or viewed differently, an organisation in Brazil with a Happiness score of +79 might celebrate beating the global Happiness score of +77 until informed that the South American average is +85.
If you would like to understand more about The Global IT Experience Benchmark: H1/2022 or how experience management will help your IT organisation, please view the full report here.
By Sami Kallio, Happy Signals